
Have you ever read your gas bill?
If you are one of the fortunate people in MA served by a natural gas utility, you probably saved a bundle this winter compared with your neighbors who burn oil, propane, or the truly unfortunate who heat with electric baseboard heaters. If you are like most people, you get your bill, it sits in a pile for a week or two, and then you pay it without scrutinizing it. If you pay online, you almost certainly don't read your bill. You may not realize it, but if you heat with natural gas you are participating in a deregulated marketplace. Lets walk through a residential NStar gas bill and see what all that stuff on the bill really means. NStar changed their bill format about two years ago to make the bill easier for the lay person to read. Luckily, they also kept the old bill format which is now printed on page two. Below, I've included a mildly redacted version of my gas bill.
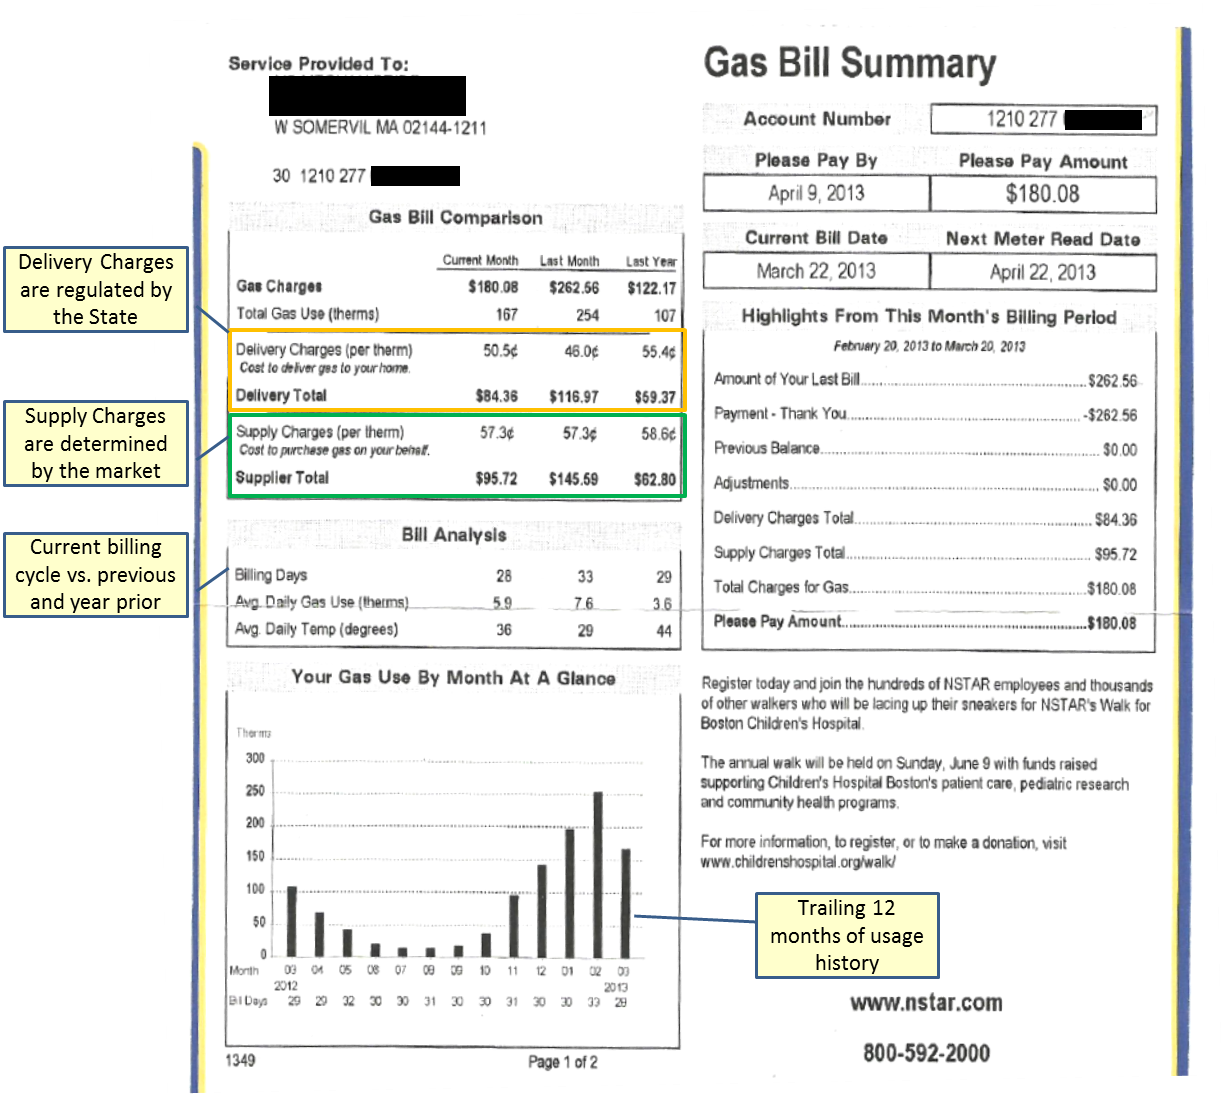
For those who crave data, page 1 may leave you wanting more, but there are some great nuggets here. Note the "Bill Analysis" section on the middle part of the left. It lists the number of days, average daily gas use, and average daily temperature for the current, previous, and year prior billing cycle. Many people compare usage from month to month or year to year without looking at the number of days in the billing period. If there is a difference in the length of the billing cycle, then you really can't make an accurate comparison unless you normalize the data to usage/day.
Natural gas is billed to customers in therms. A therm is 100,000 BTU and is a measure of heat content. For reference, one gallon of gasoline contains approximately 125,000 BTU or 1.25 therms. The utility meter doesn't read therms, instead it measures the volume of natural gas that passes through the meter each month. This volume is typically measured in hundred cubic feet or CCF, but it must be converted to therms for billing purposes since customers are buying energy (therms) not volume (CCF). The second page of the bill is nice because it shows you how this conversion is done each month.

As you can see, page two of the bill has all the fun stuff. On the middle part of the left, you'll see your rate code which you can cross reference with NStar's tariff here. Below that, you'll see your meter number. If you go outside and look at the number on your gas meter, the numbers will match. Your gas meter likely has dials on it and the reading shown on your bill reflects the position of the dials at the beginning and end of the billing cycle. The difference reflects the volume of natural gas that you've consumed, in CCF. The volume must be converted to therms and this is done by multiplying the CCF reading by the therm factor. Your natural gas utility is constantly testing the quality of its natural gas because things like moisture and impurities can impact the amount of energy it contains. The therm factor reflects the amount of energy contained in the gas that the utility delivered in a given month. It varies month to month, but not by much since your utility must adhere to strict standards regarding gas quality.
On the right side of the bill, you'll see the billing line items. Regardless if you use no gas or lots of gas, you'll always pay the customer charge. The Distribution Charges reflect the utility's base rates and change based on the season (summer vs. winter). Not that the Distribution Charges step down once you use more than 50 therms. The Distribution Adjustment also changes every few months and includes a hodgepodge of items that the utility must recover from ratepayers. This includes costs for everything from legacy environmental clean-up costs, pension liabilities, true-ups for decoupling, low income discounts, and energy efficiency programs.
The last part of the bill and potentially the most interesting is the supply portion. This charge changes approximately four times per year and is based roughly on the wholesale market price of natural gas with a lag of a few months. If you don't like the utility price of gas, you can contract with a third party to get a long term fixed price or an alternative pricing arrangement that may beat the utility. This is the essence of deregulation, or customer choice, at the consumer level. Its similar to telecom deregulation of the late 90s in that the Baby Bell provides the monopoly local service, but long distance service could be provided by another company. For gas, the gas utility owns and maintains the pipes in the ground, which is a natural monopoly, but other companies can supply gas to customers in the system and the utility will convey the gas "the last mile" to the customer's meter. Below, I've included a chart of NStar's default natural gas supply price for the last ~ 8 years.

The far right part of the historical gas supply price graph is the most important. While the debate rages among politicians over "stimulus vs. austerity" and Keynesian spending cures for our current economic malaise, few people realize that the largest economic stimulus delivered to the eastern portion of the US & Canada has been through lower natural gas prices. For the average consumer who heats their home with natural gas, the annual savings due to the Shale Gas Revolution are approximately $400 per household. If you look at the 2005 - 2008 period, the average winter cost of gas was approximately $1.20/therm. From 2009 to the present, the average winter cost of gas has been $0.80/therm or lower. For a household that consumes 1,000 therms in a heating season, this savings of approximately $0.40/therm translates to around $400 in reduced expenditure. This past winter, the savings were even greater as the cost of gas stayed under $0.60/therm. While there are certainly issues around hydraulic fracturing and ETE does believe "fracking" needs to be regulated, consumers should be grateful for the ~ $1,600 that "fracking" has saved them over the last four heating seasons ($400/yr x 4 = $1,600)